7 Best Tools for Tracking Project Progress Visually in 2026
I was three weeks into a website redesign last spring, staring at a spreadsheet that listed 47 tasks—and I had no idea which ones were actually done. My developer said he was '90 percent finished' with the backend, which I later learned meant he'd started it. That moment—when you realize your project status is basically a guess—is exactly why I spent the next six months testing every visual tracking tool I could get my hands on. Here are the seven that actually helped me see progress at a glance, no lies required.
Why Visual Tracking Matters More Than Ever in 2026
We've all been in a status meeting where someone says 'we're on track' and you feel a knot in your stomach because you know the Gantt chart hasn't been updated in two weeks. Visual progress tracking isn't just about making reports look pretty—it's about creating a shared reality that everyone can trust.
In 2026, teams are more distributed than ever. I work with folks in three time zones, and I can't walk over to their desk to ask for an update. A live visual board—whether it's a Kanban swimlane or a burndown chart—acts as a single source of truth. When I open a tool and see a task card move from 'In Progress' to 'Done,' I know exactly where we stand, without a single Slack message.
Research from the Project Management Institute has shown that teams using visual reporting tools report 30 percent fewer miscommunications about project status. That matches my own experience: after switching to a visual-first approach, I stopped getting panicked emails asking 'where are we on this?' because everyone could see the answer.
The key is that visual tracking forces you to break work into concrete, visible chunks. A list of tasks in a spreadsheet is abstract; a card that physically moves across a board is a commitment. That small psychological shift—seeing progress happen in real time—keeps momentum high and prevents the 'everything is fine until it's not' trap.
What Makes a Tool Great for Visual Progress Tracking?
Before I dive into the list, I want to share the criteria I used to evaluate each tool. I tested these over several months on real projects—a small freelance gig, a team website launch, and a personal habit tracker—so I could see how they held up under different pressures.
Here's what I looked for:
- Real-time updates: If I move a card on my phone, does it show on my teammate's screen within seconds? If not, the tool isn't worth your time in a remote world.
- Customizable views: A tool that only offers a Kanban board is fine for some workflows, but I needed Gantt charts for schedule-heavy projects and a calendar view for deadlines. Flexibility matters.
- Integrations that matter: I don't want to manually update a tracker when a task closes in Jira or a deadline changes in Google Calendar. The best tools sync automatically with your existing stack.
- Intuitive interface: If I have to watch a 20-minute tutorial to figure out how to mark a task as complete, I'm out. The tool should feel natural within an hour of use.
- Honest pricing: No hidden fees for basic visual features like Gantt charts or dashboards. I included tools with free tiers or transparent paid plans.
This list isn't about which tool has the most features—it's about which tools actually help you see progress clearly, without getting in the way.
7 Best Tools for Tracking Project Progress Visually in 2026
1. ClickUp – Best for All-in-One Visual Customization
Visual highlight: ClickUp lets you switch between Gantt, Kanban, Calendar, Box, and even a Mind Map view—all on the same project. I used the Dashboard feature to create a progress summary with a burn-up chart and a task completion percentage widget.
Honest take: ClickUp is powerful, but the learning curve is real. I spent a full afternoon setting up custom fields and automations. Once it was running, though, I could see exactly how far along each phase of my website redesign was—down to the individual subtask. The free plan is generous, but you'll want the Unlimited plan ($10/month) for Gantt views and dashboards.
Pro: Unmatched view flexibility. Con: Can feel overwhelming for simple projects.
2. Asana – Best for Timeline-Based Progress
Visual highlight: Asana's Timeline is a polished Gantt chart that shows task dependencies and critical path. When I was coordinating a product launch with five dependencies, I could drag a task's bar to adjust its date and see the ripple effect instantly.
Honest take: Asana is my go-to for projects where timing is everything. The visual progress bars on each section are a nice touch—they give me a quick 'percent complete' at a glance without diving into details. The free tier is solid for small teams, but the Premium plan ($13.49/month) unlocks Timeline and advanced reporting.
Pro: Clean, intuitive interface. Con: Gantt features are locked behind a paywall.
3. Trello – Best for Simple Kanban Visuals
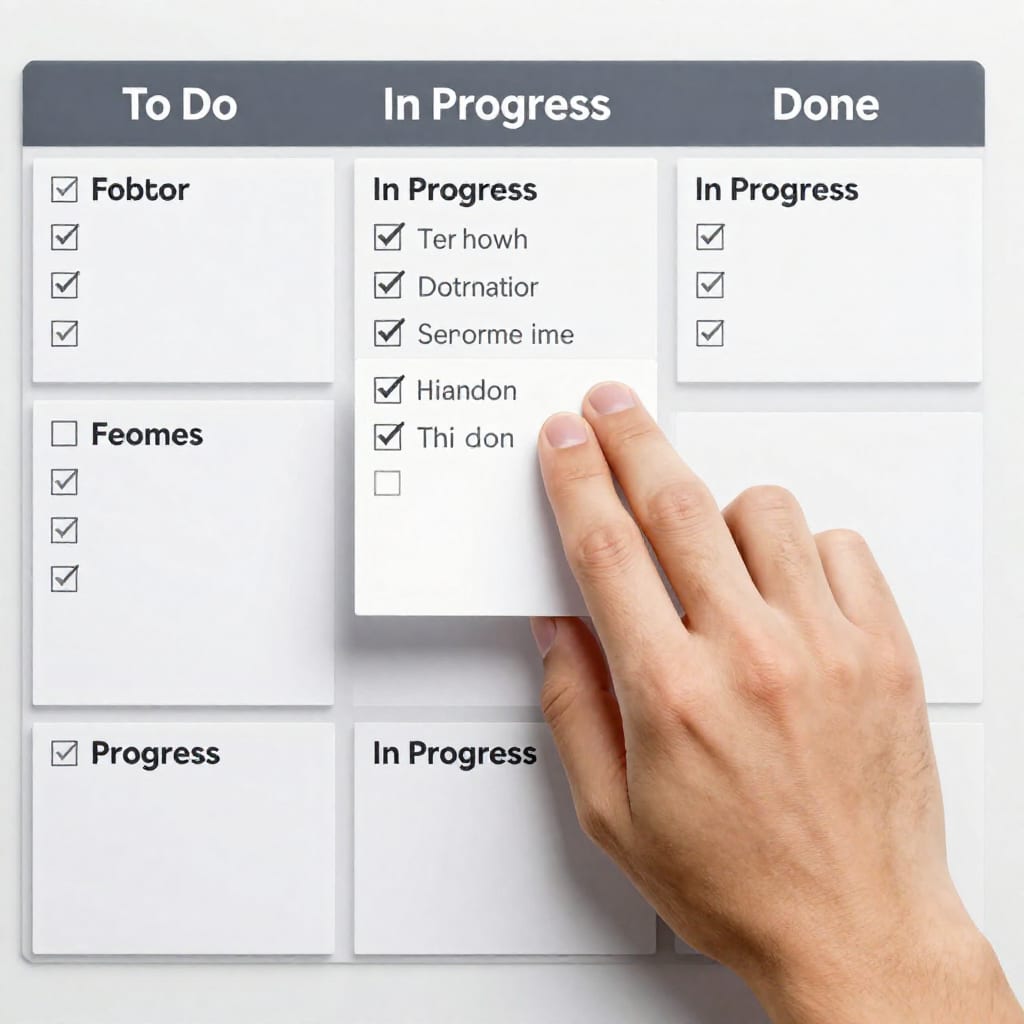
Visual highlight: Trello's Kanban boards are the gold standard for visual workflow tracking. I used it for a personal habit tracker—moving cards from 'To Do' to 'Done' felt oddly satisfying. The Butler automation (available on paid plans) can move cards automatically when due dates pass, keeping the board accurate without manual effort.
Honest take: Trello is perfect for small teams or individual projects that don't need complex timelines. But if you need to track progress across multiple dates and dependencies, you'll hit its limits fast. The free plan is excellent; the Standard plan ($5/user/month) adds custom fields and advanced checklists.
Pro: Dead simple to use. Con: No native Gantt or timeline view.
4. Monday.com – Best for High-Level Portfolio Dashboards
Visual highlight: Monday.com's dashboard widgets—like the 'Progress' chart and 'Timeline' view—let me see the status of five projects on one screen. I set up a color-coded status column (green = on track, yellow = at risk, red = behind) and could spot trouble instantly.
Honest take: Monday.com is expensive for small teams (basic plan starts at $10/user/month, but advanced features cost more). However, if you're managing multiple projects and need a bird's-eye view, it's hard to beat. The automations (like sending a notification when a task hits 'At Risk') saved me from constant check-in meetings.
Pro: Powerful dashboards. Con: Pricey per-user cost.
5. Jira – Best for Technical Teams with Sprint Tracking
Visual highlight: Jira's burndown chart and velocity chart are purpose-built for Agile teams. I used it on a software project with 12 developers, and the sprint progress bar—showing completed vs. remaining story points—was the single most useful visual I've ever used for tracking.
Honest take: Jira is overkill for non-technical teams. The interface is dense, and setting up a board requires understanding concepts like epics and sprints. But if your team already uses it for issue tracking, the visual progress features (like the road map view) are top-tier. Free for up to 10 users.
Pro: Built for Agile metrics. Con: Steep learning curve for non-developers.
6. Notion – Best for Teams That Want a Custom Visual Workspace
Visual highlight: Notion's database views—Gallery, Board, Timeline, Calendar, and List—can be combined in a single page. I created a project tracker with a progress property (using a formula that calculated percent complete based on checkbox subtasks) and displayed it as a Gallery view with a progress bar on each card.
Honest take: Notion is incredibly flexible, but that flexibility means you have to build your own system. I spent a weekend setting up my project database and automations, but once it was done, it was exactly what I needed. The free plan is generous; the Plus plan ($10/month) adds version history and custom automations.
Pro: Fully customizable. Con: Requires setup effort.
7. Smartsheet – Best for Spreadsheet Lovers Who Need Visuals
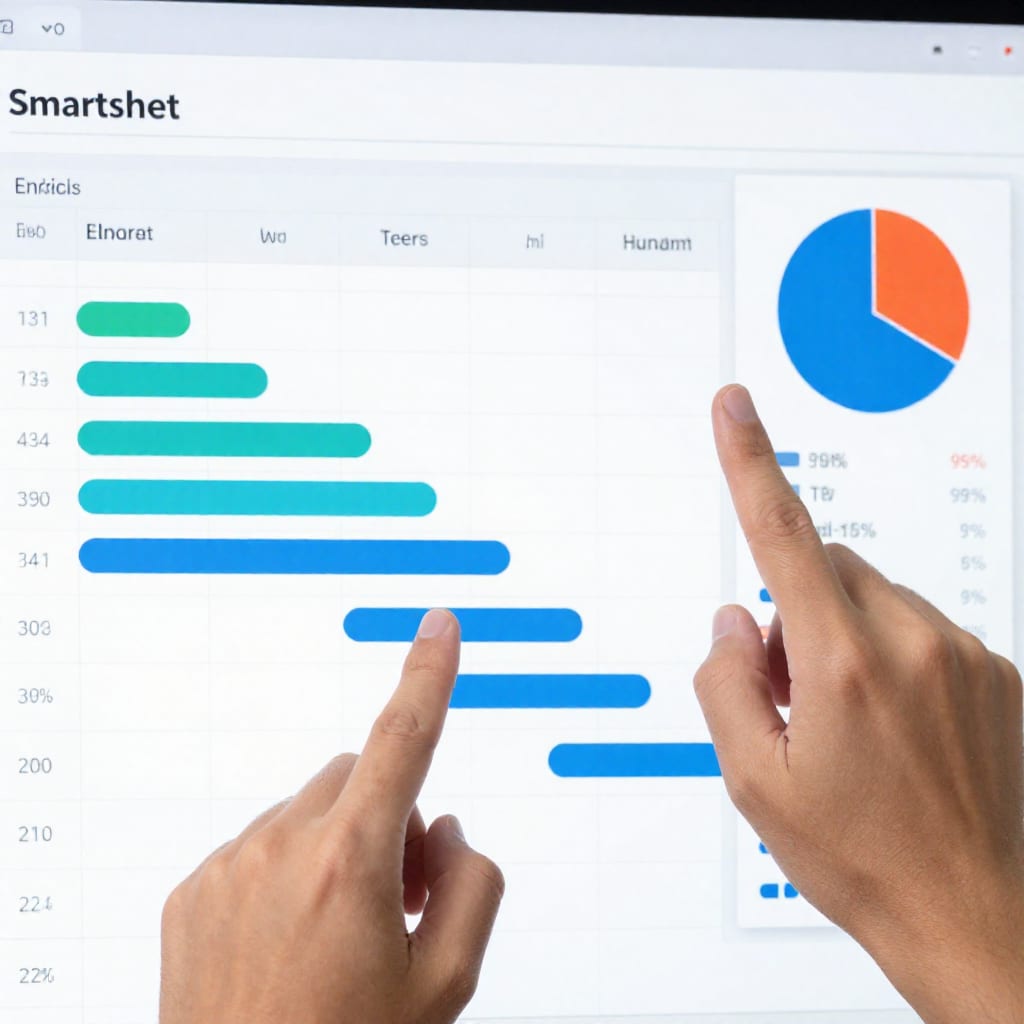
Visual highlight: Smartsheet brings Gantt charts and dashboards to a spreadsheet-like interface. I used it for a grant reporting project where the client demanded detailed row-level data but also wanted a visual timeline. Smartsheet's 'Card View' (Kanban) and 'Dashboard' widgets bridged that gap beautifully.
Honest take: Smartsheet is not the prettiest tool, but it's the most practical for data-heavy projects. If your stakeholders love Excel but need visuals, Smartsheet is your answer. Plans start at $7/user/month, but the more useful features (like dashboards) require the Pro plan ($25/user/month).
Pro: Powerful for data reporting. Con: Interface feels dated.
How to Choose the Right Tool for Your Team
After testing all seven, here's my honest decision framework:
- Small team (1–5 people), simple projects: Trello or Notion. Trello if you want zero setup; Notion if you want to build a custom system over time.
- Medium team (5–20 people), timeline-heavy projects: Asana or ClickUp. Asana for cleaner UX; ClickUp for more views.
- Technical team, Agile sprints: Jira. Don't fight it—it's what your developers already know.
- Portfolio management, multiple projects: Monday.com or Smartsheet. Monday for dashboards; Smartsheet for data depth.
- Budget-conscious: Start with Trello (free) or ClickUp (free plan with Gantt). Upgrade only when you hit limitations.
One counter-intuitive insight I learned: more visual options don't always mean better progress tracking. I tried a tool that offered 15 different chart types, and I spent more time choosing the view than actually updating the work. The best tool is the one your team will actually use consistently—even if it's 'boring' like Smartsheet.
If you're still unsure, pick one tool and commit to using it for two weeks. Update it daily, even if it's just moving one card. You'll quickly see whether the visual feedback loop helps you catch delays earlier. In my experience, it does—and that alone is worth the switch.
FAQ
What is the best free tool for tracking project progress visually?
Trello's free tier is excellent for Kanban-based tracking, and ClickUp's free plan includes Gantt views. For small teams, these are solid starting points. Just know that true visual dashboards (like burn-up charts) often require a paid upgrade.
Can I use Microsoft Excel or Google Sheets for visual project tracking?
Yes, with conditional formatting and charting, but they lack real-time collaboration and automation. They work for simple projects but aren't scalable. I've used Sheets for personal trackers, but for team projects, a dedicated tool saves hours of manual upkeep.
What's the difference between a Gantt chart and a Kanban board for visual tracking?
Gantt charts show timeline dependencies and task durations—great for schedule-heavy projects like construction or event planning. Kanban boards show workflow stages and work-in-progress limits—better for continuous flow tasks like content creation or support tickets. I use Gantt for project schedules and Kanban for daily task management.
Are these tools suitable for remote or hybrid teams in 2026?
Yes, all seven tools offer cloud-based access, real-time updates, and mobile apps. I work with a hybrid team, and we've used Asana and ClickUp successfully—everyone can see the same board from anywhere.
How often should I update visual progress trackers to keep them accurate?
At least daily or after every key task completion. The best tools automate this through integrations (e.g., with Slack or Jira) so it's less manual work. I aim for a quick 5-minute update at the end of each day—it keeps the visual honest and saves status meetings.
Practical takeaway: Visual progress tracking is about creating a shared reality, not a pretty chart. Pick one tool, update it daily, and watch your project clarity improve. If you're juggling multiple projects, start with ClickUp or Monday.com for the dashboard overview—but don't overthink it. The best tool is the one you'll actually use.